Overview

Figure 1: Photo of a SPOT tag (upper most device) attached to the dorsal surface of white shark Mary Lee. Watch the video of Lydia being tagged here. Photo courtesy of Ocearch.org.
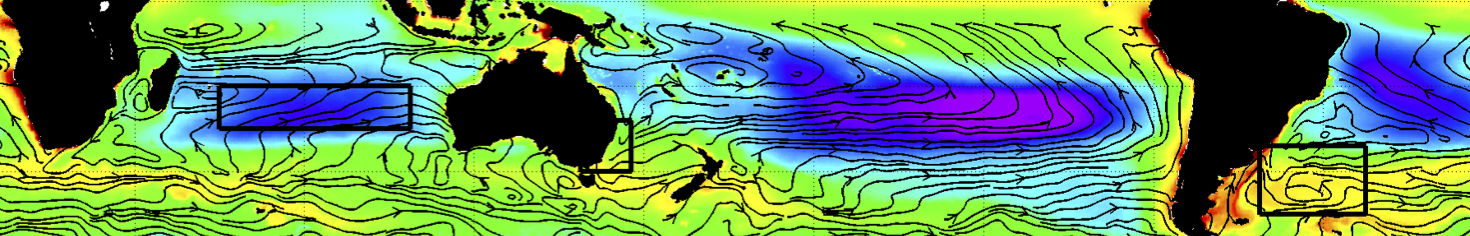
Mesoscale eddies, large swirling bodies of water with horizontal scale on the order of 100 km, are a common feature of the World Ocean, covering nearly 30% of the ocean surface at anytime. One of the numerous effects of eddies on primary production in the ocean is the generation of upwelling and downwelling, and the transport of ecosystems over large horizontal distances. How megafauna like sharks and other pelagic fish who live in the open ocean interact with eddies remains largely a mystery. With colleagues Dr. Simon Thorrold and Mr. Camrin Braun at the Woods Hole Oceanographic Institution, Dr. Greg Skomal at the Massachusetts Marine Fisheries, the Ocean Life Institute and Ocearch, we are addressing this mystery through the analysis of sharks’ trajectories recorded by high-precision SPOT (Smart Position or Temperature Transmitting) satellite tags (Fig. 1, deployed by Ocearch.org) in relation to the contemporaneous location and movement of mesoscale eddies identified and tracked in satellite-derived maps of sea surface height (SSH). Our preliminary analysis suggests that white sharks in the North Atlantic have a significant preference for the interiors of clockwise rotating anticyclonic eddies versus counterclockwise rotating cyclonic eddies.
In addition to studying where sharks swim and feed in relation to the geographic location of eddies, we are also investigating the vertical structure of eddies and their influence on the deep scattering layer (DSL), a stratum centered at around 700m depth with high concentrations of small, mesopelagic fishes and cephalopods (squids). The vertical structure is assessed by collocating temperature profiles measured by sensors affixed to white sharks and observations made by autonomous profiling Argo floats to the interiors of eddies tracked in maps of SSH. An early result from this study is that the foraging dives of a mature white shark in the North Atlantic suggests that the DSL is deeper in anticyclones. We are now investigating whether the depth of the DSL in eddies is related to physical properties such as stratification which can be measured by Argo floats and shark-based temperature.
The Details

Figure 2: Photograph of white shark Lydia prior to release. Photo courtesy of Ocearch.org.
Mesoscale eddies have been identified as “hot spots” of primary production in oligotrophic regions (Falkowski et al. 1991, McGillicuddy et al. 1998, McGillicuddy et al. 2007, Thompson et al. 2007) and have been proposed to provide the “missing” nutrient flux required to close observed nutrient budgets in the subtropical North Atlantic (McGillicuddy & Robinson 1997). Yet the influence of eddies on higher trophic levels remains a mystery. Pelagic fishes such as yellowfin and bluefin tuna have long been associated with mesoscale eddies in the open ocean (Sund et al. 1981, Teo & Block 2010). Recent advances in satellite tagging technology have facilitated the tracking of large marine predators, such as the white shark (Carcharodon carcharias), with a precision making possible the investigation of mesoscale features used by these apex predators. Smart Position or Temperature Transmitting (SPOT) tags (Fig. 1) transmit accurate locations while sharks swim in the surface layer. Combining these tags with pop-up archival tag technology (miniPAT tag; Wildlife Computers, Inc.) to collect pressure-temperature data allows three-dimensional reconstruction of a shark’s daily movements. By collocating the trajectories of marine megafauna with the physical and biological signatures of eddies, the association of particular species with counterclockwise eddies (cyclones), or clockwise eddies (anticyclones), can be investigated.
The use of different parts of an eddy by marine animals, either the core or perimeter, can give insight into what these organisms are doing while in a particular mesoscale eddy. For instance, recent studies of the foraging behavior of loggerhead sea turtles revealed that turtles are often found either at the periphery (Polovina et al. 2004, Foley et al. 2013) or in cores (Kobayashi et al. 2011, Gaube et al. in prep) of open-ocean eddies, depending on the geographical region and turtle life stage.
To investigate the use of different portions of mesoscale eddies by white sharks, we first identify and track eddies from closed contours on maps of sea surface height anomaly (SSH, details of our eddy tracking procedure can be found in appendix B of Chelton et al., 2011). The eddy center is identified as the SSH extremum within the outermost closed contour of SSH characterizing the eddy. The geographic positions of sharks outfitted with satellite location tags are then collocated with the closest eddy SSH extremum of the mesoscale eddies.
A preliminary analysis of the use of mesoscale eddies by a large (~900 kg), mature female white shark named Lydia (Fig. 2) revealed that she is significantly more likely to occupy the interiors of anticyclonic eddies than cyclonic eddies (Fig. 3b-d). The next step will be to collocate the trajectories of all sharks outfitted with high-precision satellite location tags to eddies position to investigate if this preference for the cores of anticyclones is observed across different regions of the World Ocean and amongst different species and individuals.
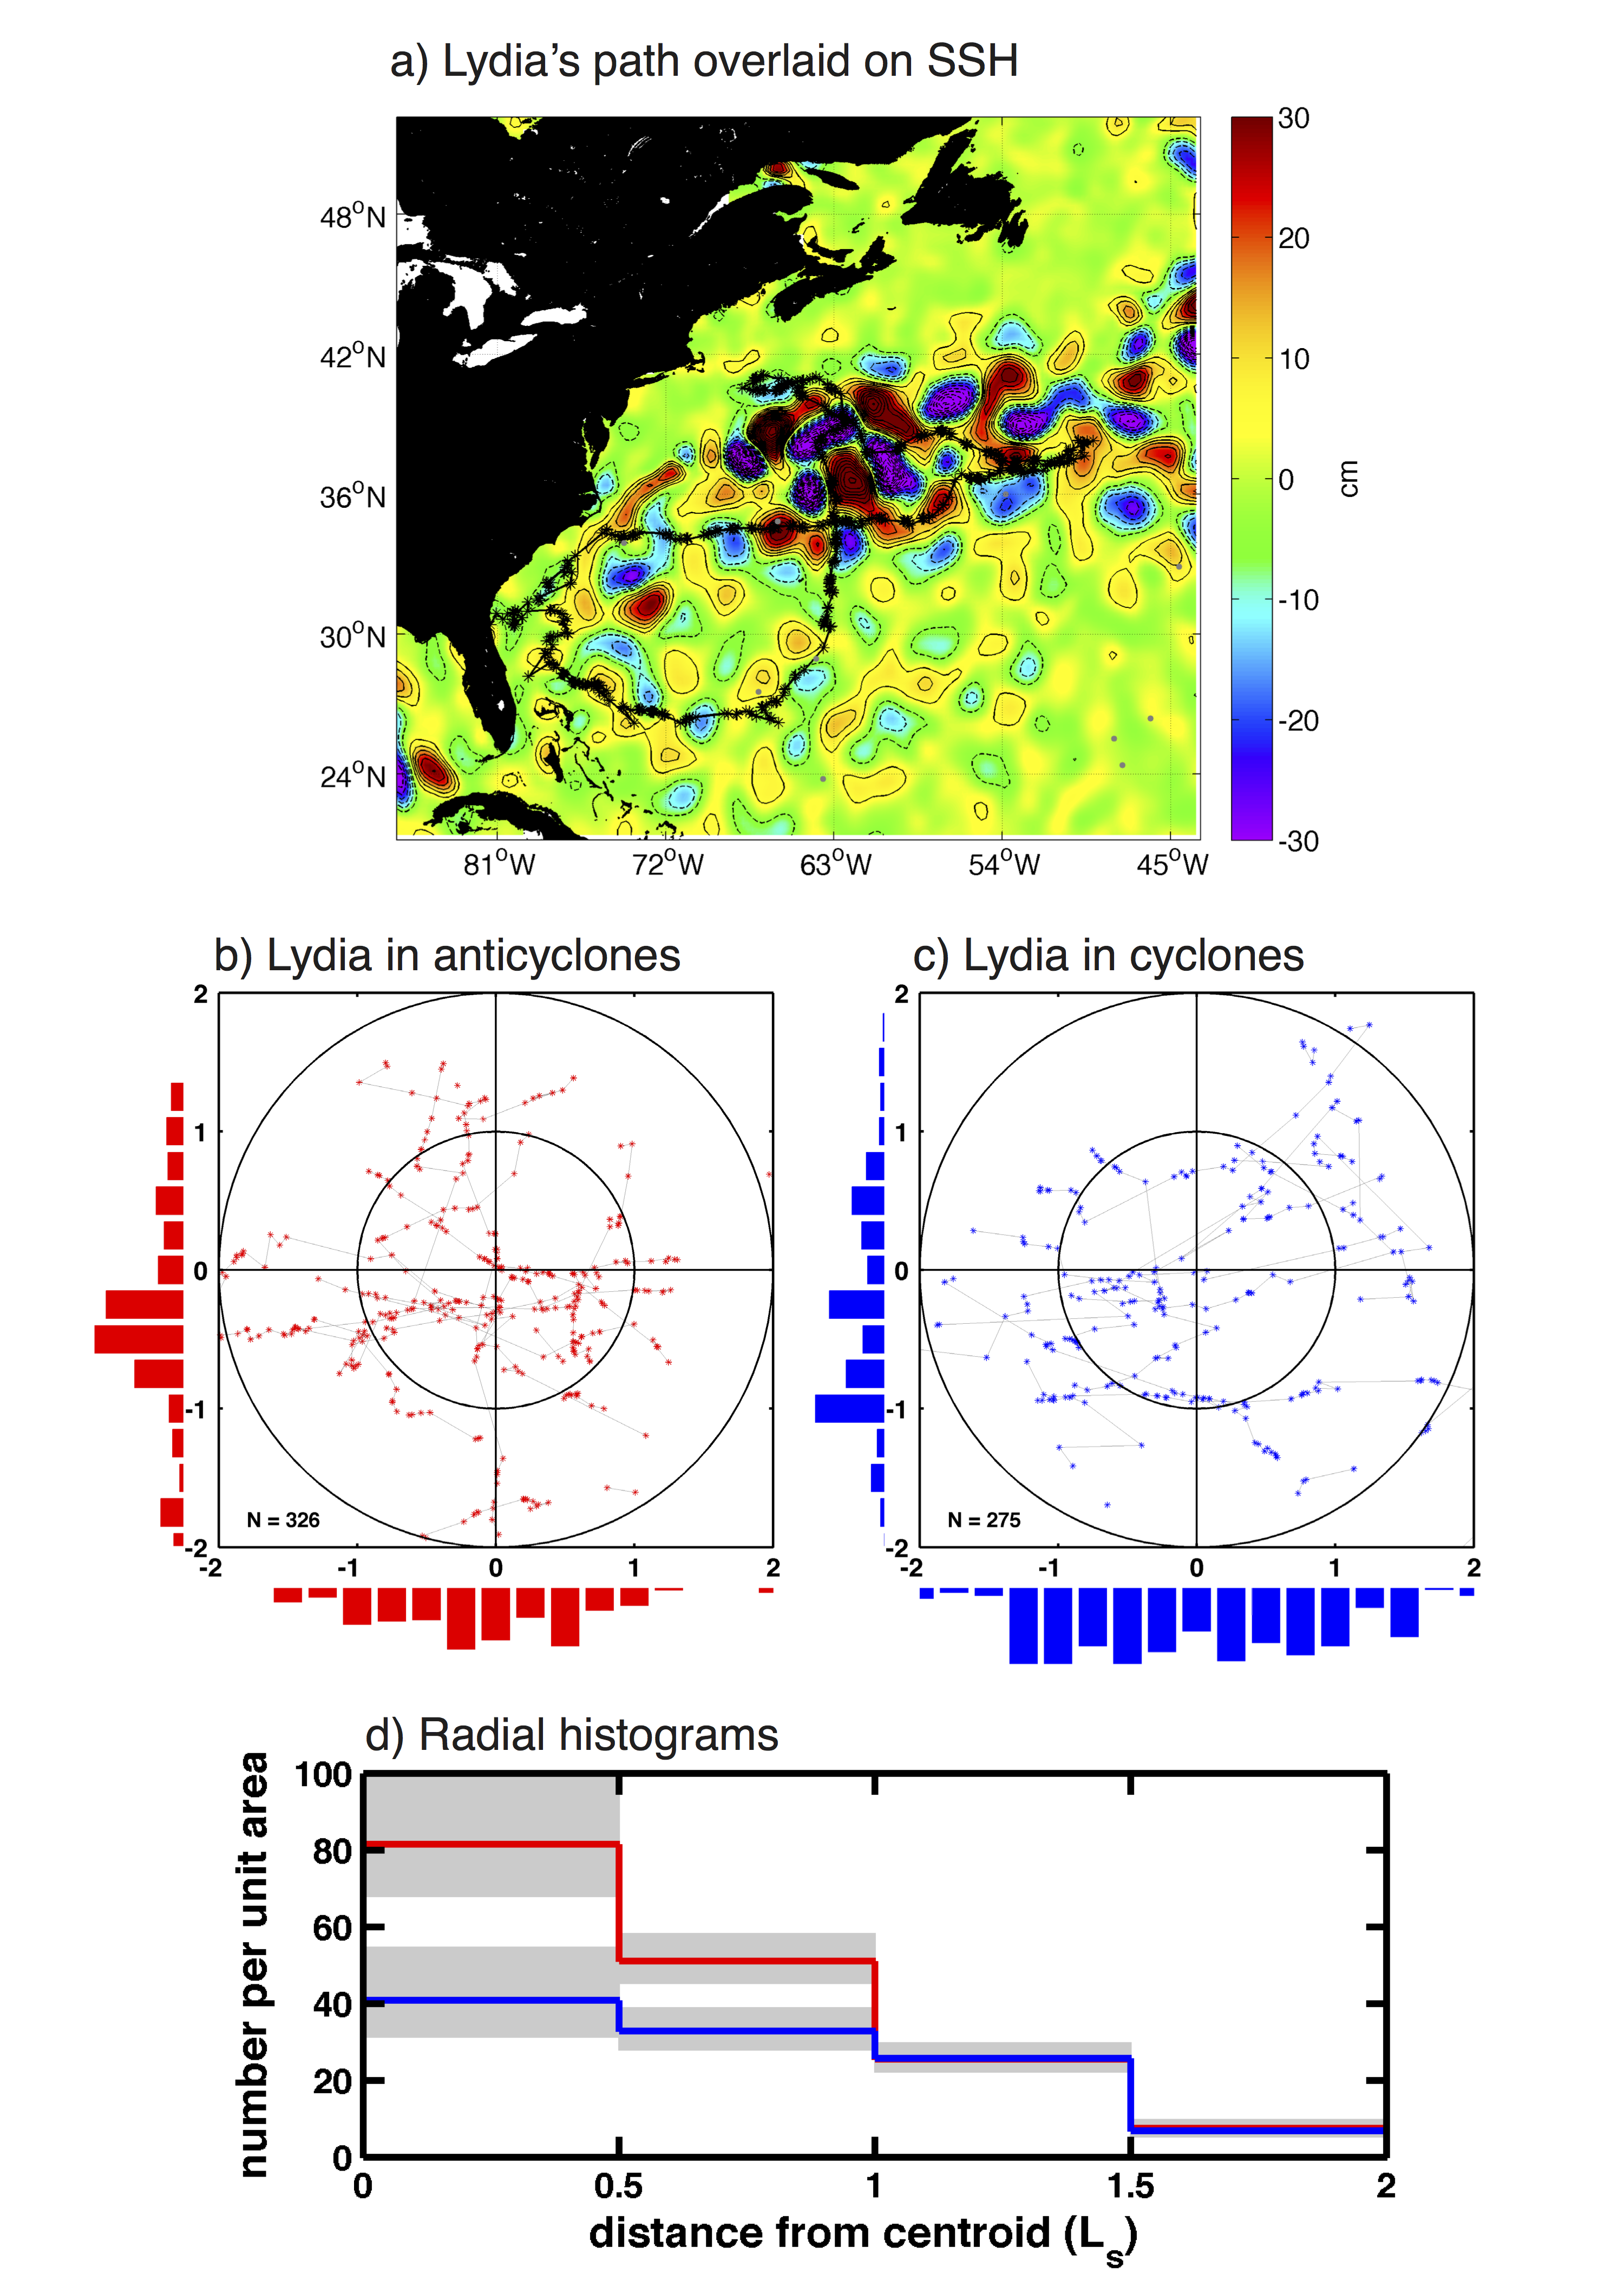
Figure 3: (a) The path of the ~900 kg. mature female white shark Lydia as recorded by a SPOT tag affixed to her dorsal fin, overlaid on a map of SSH for the week of 4 August, 2013. Anticyclonic eddies (positive SSH anomalies) are shown in red, cyclonic eddies (negative SSH anomalies) in blue to purple. Daily position estimates of Lydia when she occupied anticyclonic and cyclonic eddies are shown in panels (b) and (c), respectively. The x and y axes in each panel have been scaled by the eddy radius scale Ls, defined to be the radius of a circle with area equal to that enclosed by the outermost closed SSH contour. (d) Histograms of the number of daily SPOT locations per unit area of each radial annulus, as a function of radial distance from the closest eddy center. SPOT locations associated with anticyclones and cyclones are shown as red and blue stepped curves, respectively. The x axes has been scaled by the horizontal eddy radius scale Ls. The 95% confidence interval of each radial bin is shown by grey shading. Confidence intervals for the binomially distributed location counts were computed following Clopper and Pearson (1934).
In addition to analyzing how sharks use different portions of cyclonic and anticyclonic eddies, we are also investigating the diving behavior of large pelagic fish inside eddies. The white shark Lydia was also outfitted with a temperature and pressure sensor that recorded data along her path through the North Atlantic. After six months of sampling, daily summaries of her temperature profiles were transmitted to WHOI via the Argos satellite constellation.
From the collocation of these temperature profiles to the interiors of eddies, we observed that Lydia dived to an average depth of 667m in anticyclones and 611m in cyclones (Fig. 4). These depths are consistent with the day-time vertical position of the deep scattering layer (DSL). Mesopelagic fishes and cephalopods are primarily located in these DSLs and likely dominate the world total fish biomass (Lam & Pauly 2005, Irigoien et al. 2014). The association of the maximum dive depth with the known location of the DSL suggests that Lydia is actively feeding on mesopelagic fish and then returns to the warm surface waters where SPOT positions are transmitted. The analysis of both the geographical location of Lydia’s path through the North Atlantic and the temperature profiles collected during her dives within eddies suggests that this particular shark’s primary prey is likely more concentrated deeper in the water column in anticyclones than cyclones. We are currently considering a number of statistical tests to assess the significance of these differences between cyclones and anticyclones.
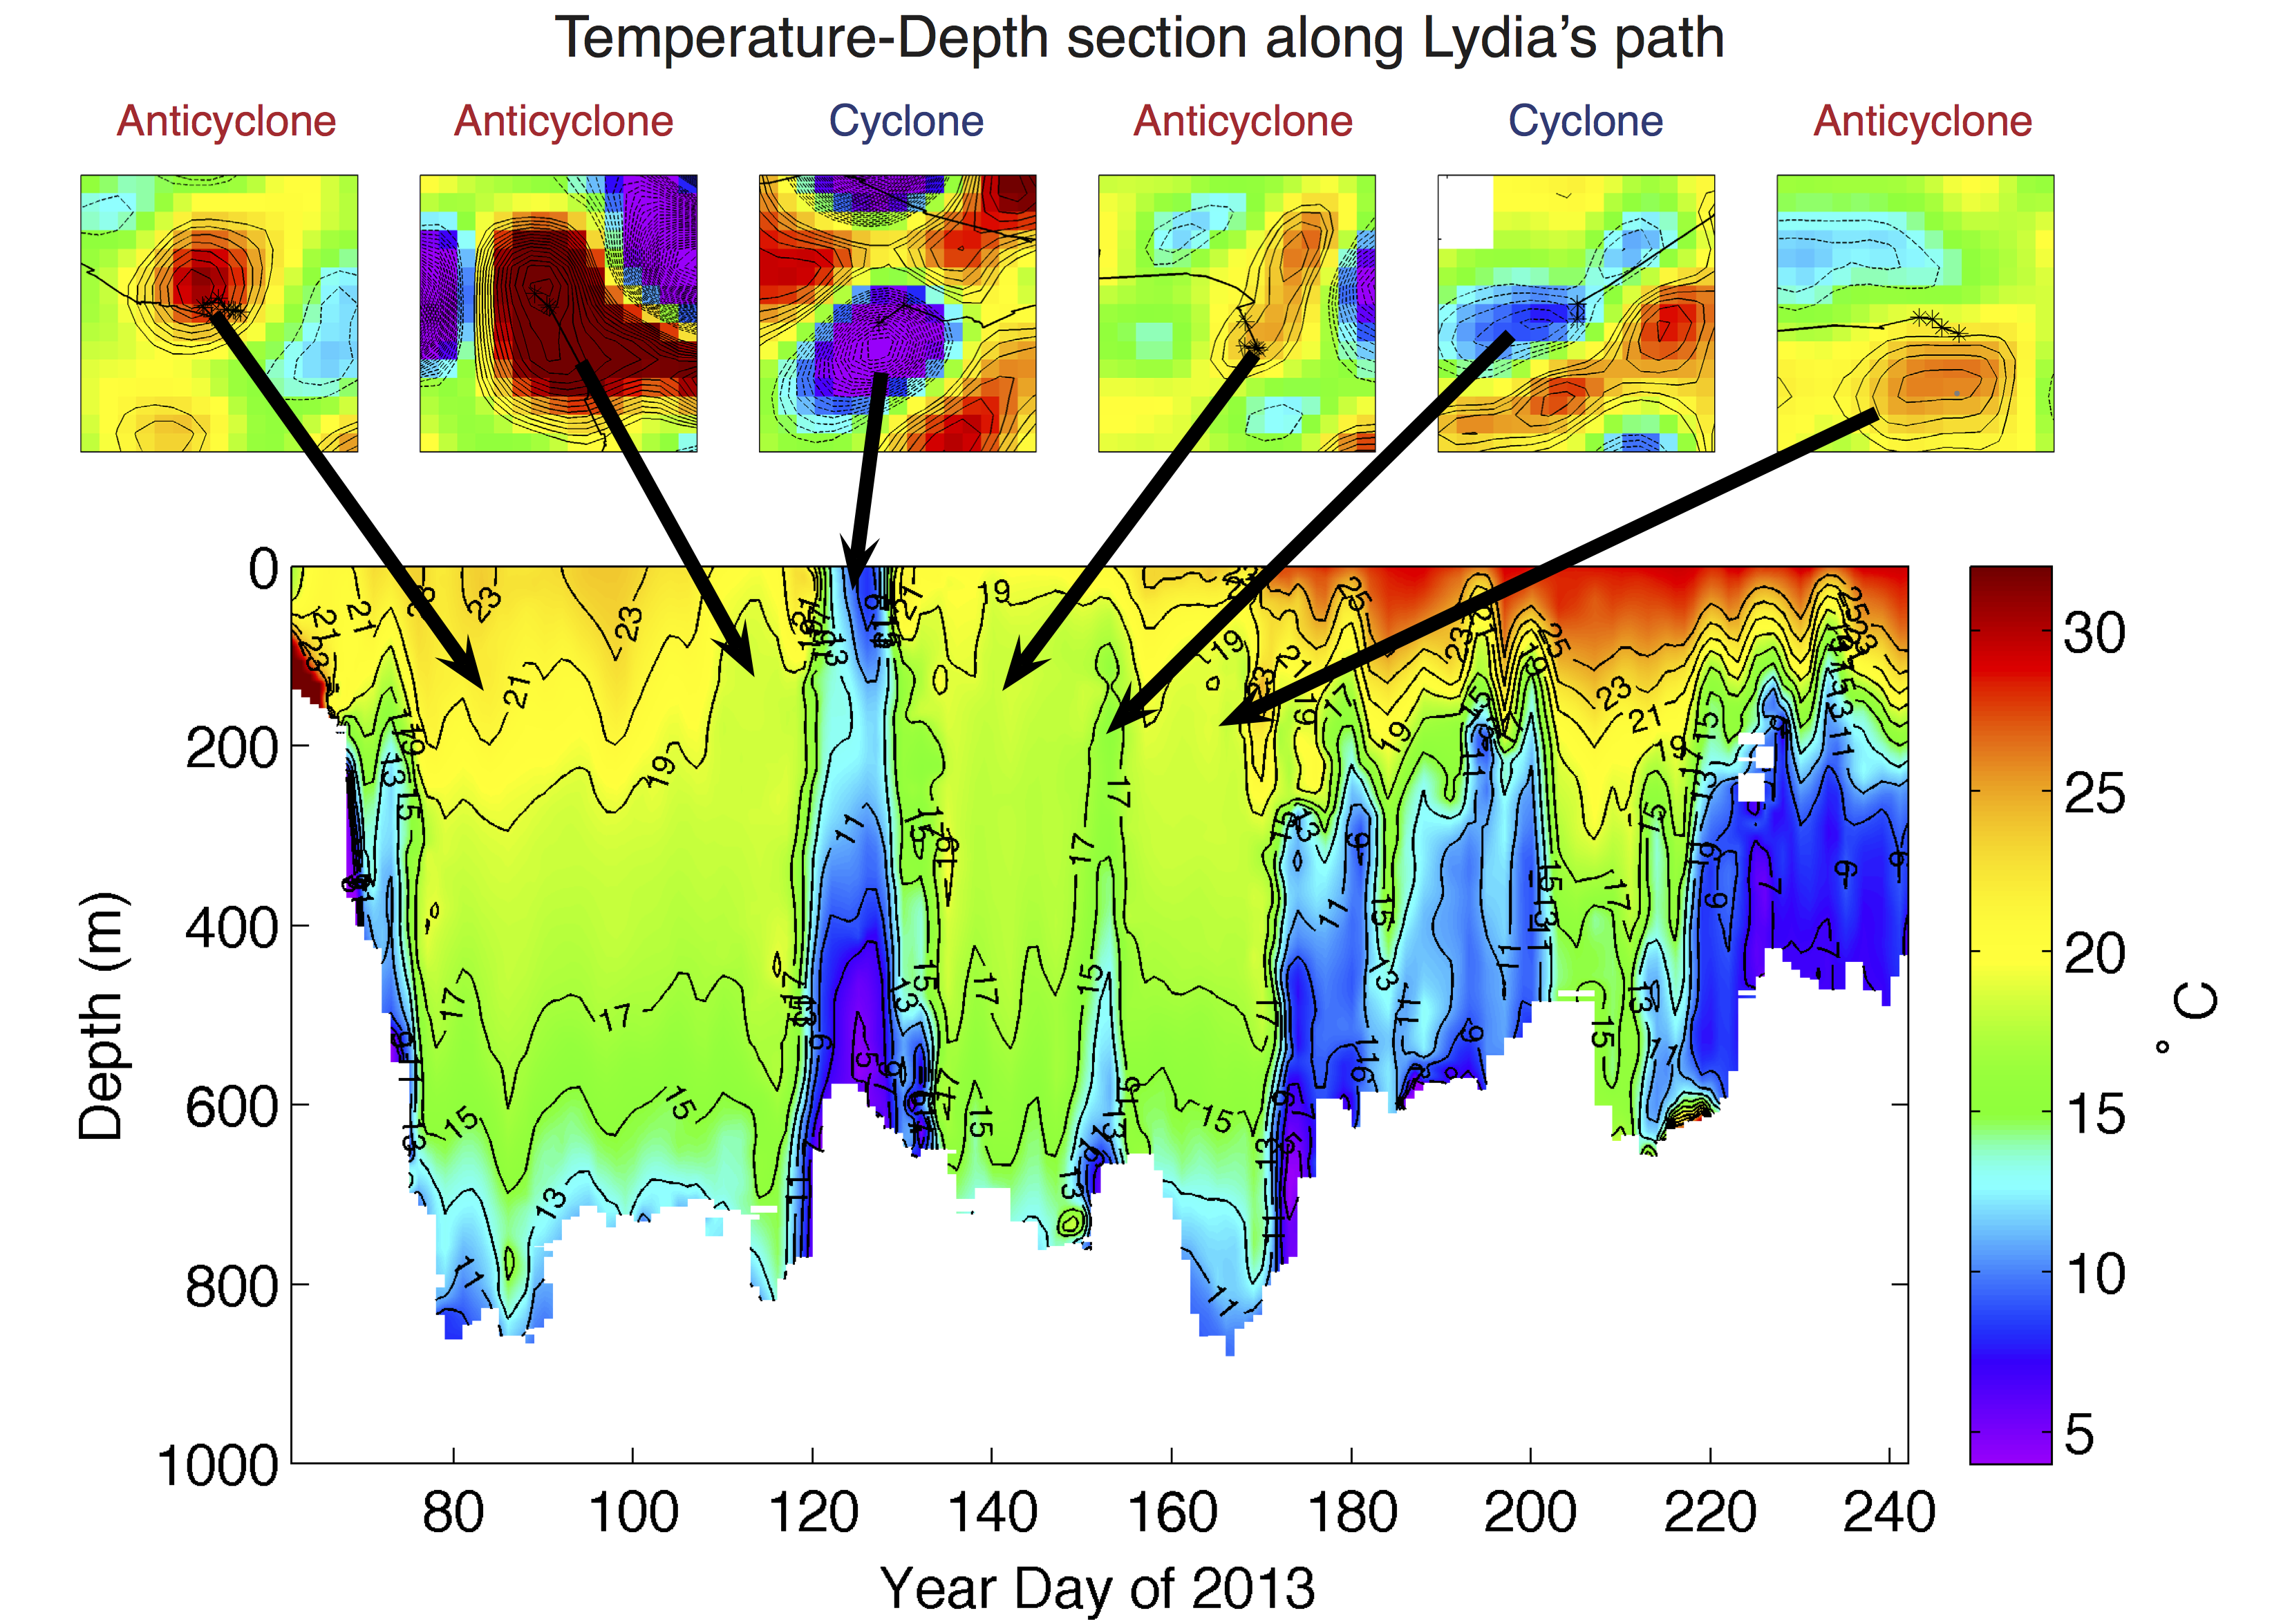
Figure 4: Temperature-Depth section collected by a pop-up archival tag (miniPAT) affixed to Lydia’s dorsal surface. The six panels above the section are snapshots of SSH overlaid with Lydia’s SPOT location estimates. Each of the panels is labeled as either an anticyclone, resulting in a downward displacement of isotherms in the temperature-depth section, or a cyclone, resulting in the shoaling of isotherms. The maximum depth of each dive is recorded as the transition from the pseudo-color image to white. Dives within anticyclones are always deeper than within cyclones.
The influence of mesoscale eddies on the depth and composition of the DSL has been documented in a number of regions (Simard & Mackas 1989, Sabarros et al. 2009, Godø et al. 2012). However, our observations of the vertical temperature structure of eddies and the presumed location of the DSL collected by the tag on Lydia allow us the unique opportunity to investigate not only the spatio-temporal variability of the DSL, but how it is used by pelagic fish, such as white sharks, and why they appear to preferentially feed at the DSL inside anticyclones. To support this effort, we are using protocols developed by Dr. Peter Gaube to investigate the vertical structure of eddies from water density collected by Argo profiling-floats collocated to the interiors of eddies. These density profiles are linked to the data collected by Lydia to probe the role of eddies in structuring the surface and sub-surface ecosystem where pelagic fish evolve.
Our ongoing investigation using both SSH data from satellite and in situ vertical temperature profiles will allow for an unprecedented look at how eddies are used by marine megafauna and the influence of eddies on DSLs. We hope the results from this study will guide a future interdisciplinary project to investigate the links between mesoscale eddies and the distribution and trophic ecology of both the DSL and the large marine predators who appear to actively forage in these layers.
References
Chaigneau A, Eldin G, Dewitte B (2009) Eddy activity in the four major upwelling systems from satellite altimetry (1992–2007). Progress in Oceanography 83:117–123
Chelton DB, Schlax MG, Samelson RM (2011) Global observations of nonlinear mesoscale eddies. Progress in Oceanography 91:167–216
Clopper C, Pearson ES (1934) The use of confidence or fiducial limits illustrated in the case of the binomial. Biometrika 26:404–413
Falkowski PG, Ziemann D, Kolber Z, Bienfang PK (1991) Role of eddy pumping in enhancing primary production in the ocean. Nature 352:55–58
Foley AM, Schroeder BA, Hardy R, MacPherson SL, Nicholas M, Coyne MS (2013) Postnesting migratory behavior of loggerhead sea turtles Caretta caretta from three Florida rookeries. Endangered Species Research 31:129-142
Gaube P, Barcelo C, McGillicuddy Jr DJ (2014) Use of mesoscale eddies by juvenile loggerhead sea turtles. in preperation for Marine Ecology Progress Series
Godø OR, Samuelsen A, Macaulay GJ, Patel Rand others (2012) Mesoscale eddies are oases for higher trophic marine life. PloS one 7:e30161
Irigoien X, Klevjer T, Røstad A, Martinez Uand others (2014) Large mesopelagic fishes biomass and trophic efficiency in the open ocean. Nature communications 5
Kobayashi DR, Cheng I-J, Parker DM, Polovina JJ, Kamezaki N, Balazs GH (2011) Loggerhead turtle (Caretta caretta) movement off the coast of Taiwan: Characterization of a hotspot in the East China Sea and investigation of mesoscale eddies. ICES Journal of Marine Science: Journal du Conseil 68:707-718
Lam V, Pauly D (2005) Mapping the global biomass of mesopelagic fishes. The Sea Around Us Project Newsletter, July/August
McGillicuddy D, Robinson A (1997) Eddy-induced nutrient supply and new production in the Sargasso Sea. Deep Sea Research Part I: Oceanographic Research Papers 44:1427-1450
McGillicuddy D, Robinson A, Siegel D, Jannasch Hand others (1998) Influence of mesoscale eddies on new production in the Sargasso Sea. Nature 394:263–266
McGillicuddy DJ, Anderson LA, Bates NR, Bibby Tand others (2007) Eddy/wind interactions stimulate extraordinary mid-ocean plankton blooms. Science 316:1021
Polovina JJ, Balazs GH, Howell EA, Parker DM, Seki MP, Dutton PH (2004) Forage and migration habitat of loggerhead (Caretta caretta) and olive ridley (Lepidochelys olivacea) sea turtles in the central north Pacific Ocean. Fisheries Oceanography 13:36–51
Sabarros PS, Ménard F, Lévénez J-J, Tew-Kai E, Ternon J-F (2009) Mesoscale eddies influence distribution and aggregation patterns of micronekton in the Mozambique Channel. Mar Ecol Prog Ser 395:101-107
Simard Y, Mackas DL (1989) Mesoscale aggregations of euphausiid sound scattering layers on the continental shelf of Vancouver Island. Canadian Journal of Fisheries and Aquatic Sciences 46:1238-1249
Sund PN, Blackburn M, Williams F, others (1981) Tunas and their environment in the Pacific Ocean: A review. Oceanogr Mar Biol Ann Rev 19:443–512
Teo SL, Block BA (2010) Comparative influence of ocean conditions on yellowfin and atlantic bluefin tuna catch from longlines in the Gulf of Mexico. PLoS One 5:e10756
Thompson PA, Pesant S, Waite AM (2007) Contrasting the vertical differences in the phytoplankton biology of a dipole pair of eddies in the south-eastern Indian Ocean. Deep Sea Research Part II: Topical Studies in Oceanography 54:1003–1028
